Everything about Google Analytics 4

The latest version of Google Analytics, GA4, provides updated reporting tools for analyzing website statistics.
Google made GA4 the recommended version for all new Google Analytics users and new property creators in October 2020.
If your Google Analytics is pre-configured for GA3, you can still use it. Google has not announced that it will restrict the use of GA3. At least, not any time soon.
What’s the difference between GA3 and GA4
GA3, or Universal Analytics, used a session-based model to gather information about what was happening on the website. GA3 collected and stored data such as page views, activities, transactions, and more.
GA4 allows you to analyze data from different devices, which means it is now possible to collect data about website and mobile app visitors on a single platform and analyze those statistics on a single platform.
The GA4 model gives marketers more freedom because we can create our own activity-based metrics and rules to measure visitor activity.
More accurate than GA3
The GA4 model gives marketers more freedom because we can create our own activity-based metrics and rules to measure visitor activity.

Should you start using GA4?
An active need to use GA4 should arise if you need to measure application traffic/activities in addition to the website.
We and Google recommend creating a GA4 property in parallel with GA3.
Check out the possibilities of GA4. New reporting tools help you better understand your website visitors.
GA4 is a more visual tool that provides an overview of what’s going on on a website with various dashboards. At the same time, GA4 allows activity-based monitoring.
Based on this information, the average user will get a clearer picture of what is happening on the website.
How to use Google Analytics 4?
When using Google Analytics GA4, the menu on the left is immediately visible, which is more meaningful than in the GA3 version.
In total, Google Analytics GA4 has five basic reporting tools:
- Life Cycle – provides an overview of the channels through which people reach the website and what they do there;
- User – demographic and technological overview of website visitors;
- Events – an overview of defined KPIs, ie the ability to monitor how the performance of the website increases/decreases over time;
- Explore – allows you to visually analyze what is happening on a website by segmenting various data and visualizing it using the Analysis hub tool;
- Audiences – helps you create different audiences that can be used for segmentation at a later stage of analysis.

01Home
The Home report acts as a bulletin board that shows how website traffic has changed over a period of time.
When you sign in to Google Analytics, you will have instant access to the critical information.
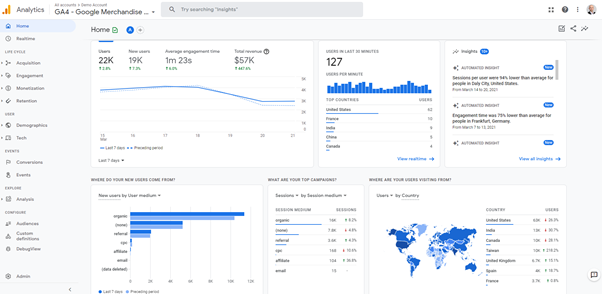
Let’s take a closer look at what information is displayed there.
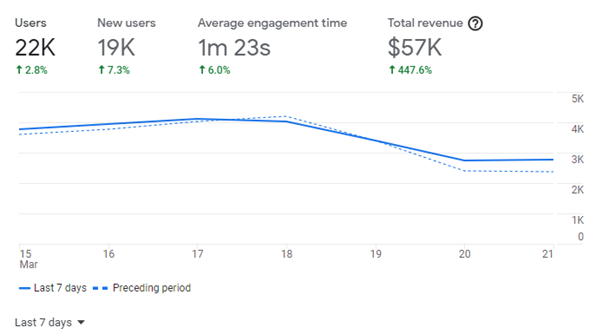
An overview of the main indicators of the website, such as the number of visitors to the website, the number of new visitors, the average time of the visit and the turnover of the online store during the selected period.
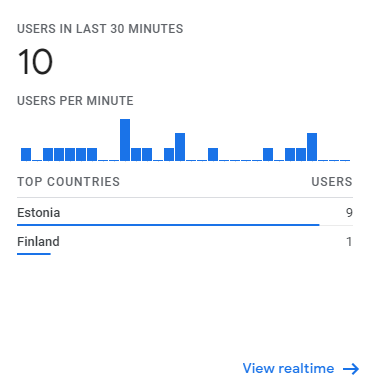
An overview of visits from the last 30 minutes, both numerically and geographically.
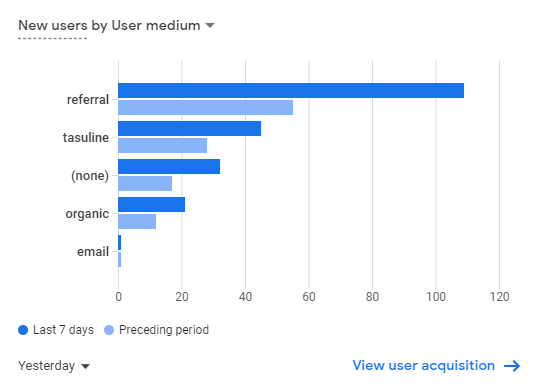
GA4 reports are more interactive than GA3. The data is transmitted in a more visual form, which is characterized very well by the graph below, where users’ preferences for the choice of media are visually highlighted over the last 7 days.
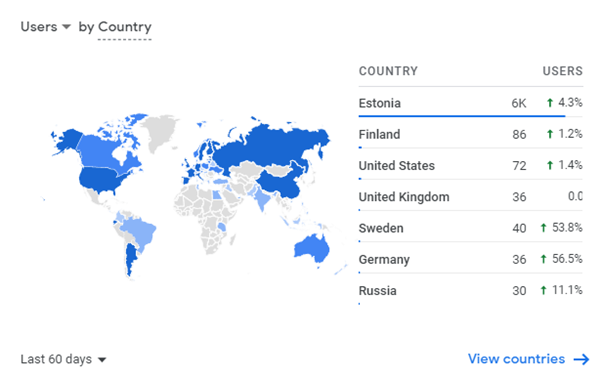
The same applies to geographic indicators if you want to compare the relationship between web traffic and geographic locations
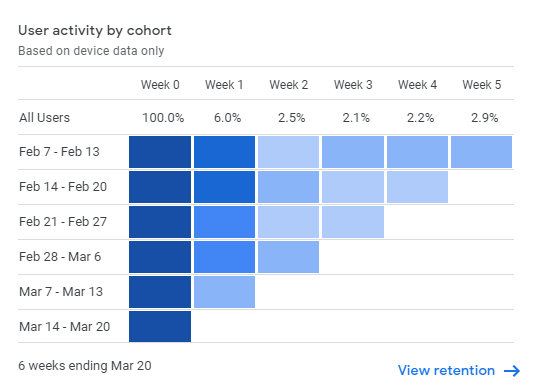
Cohort Analysis is on the front page, allowing you to quickly and easily access information about how repeated visits to your website occur over time.
02Realtime
The Realtime report has undergone a complete change. It is now possible to get a quick overview of what’s going on on one page.
You can track the geographical location of your visitors, the websites you visit, the activities you do, and the channels you use to reach your website.

Life Cycle
The Life Cycle report is a good tool to help you understand how your website is being reached, what is being done there, and how much traffic your website is earning.
03Acquisition
The Acquisition report shows how many people visit your website, what geographical locations they use, and the channels through which the website was accessed.
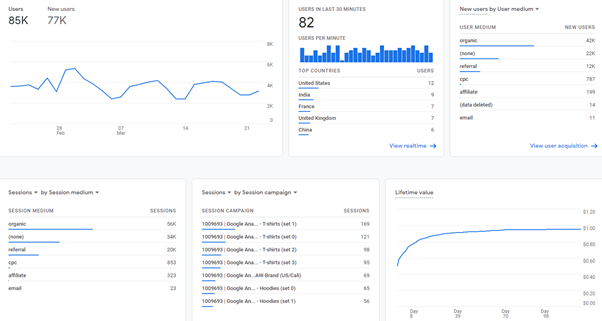
The display of statistics for the Acquisition report has changed. In GA4, data is displayed as standard solutions. If you want more detailed information, you can do so with segmentation.
It could be said that for the average user who just needs an overview of what is going on on the website, GA4 is a simpler and more convenient tool than GA3.

In GA4, the bounce rate is not as important as it was in GA3.
In GA4 we were introduced to Engaged sessions.
Google defines them as sessions on a webpage that last longer than 10 seconds, followed by 1 or more conversions/actions, and viewed 2 or more times on different pages.
Instead of a bounce rate metric, we can now better monitor website activity and optimize our deficits.

If we want to segment the statistics, we can do so under Secondary Dimensions.

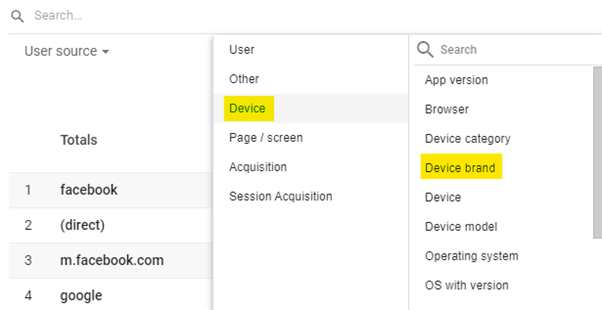
04Engagement
The Engagement report allows us to get a better idea of what people have done on the website.
Overview:
- Activities performed
- Visits to various pages on the website
- Website visit time.

05Ecommerce Purchases
Gives you an overview of the following indicators:
- Product viewings
- “Add to cart”
- Shopping cart view rate
- E-shop purchases
- Total number of products purchased
- Turnover per product.
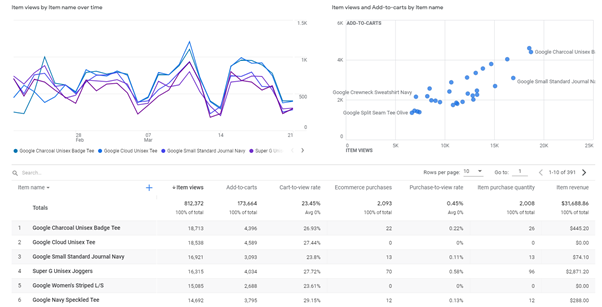
06Retention
A comprehensive report to understand how many people will return to your website after their first visit.
You can also see visually how the time spent on the website changes over time.
In this example, we can see that during their first visit, they spend less time on the page. But the longer the time passes from your first visit, the longer they spend time on the website.

User
07Demographics
Demographic overview of website visitors. Allows you to analyze how old your visitors are and whether they are women or men.
Google Analytics allows you to analyze these statistics using different segments.

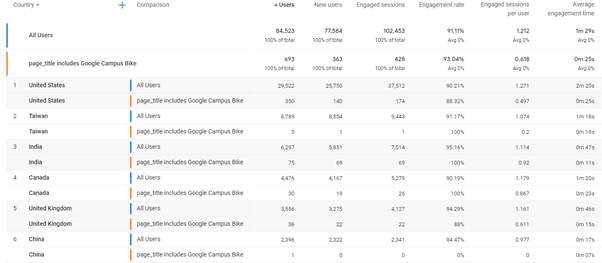
08Tech
A detailed overview of the devices with which people visit your website. Among others:
- What operating system do they use most frequently?
- What type of device do people use your website with?
- From which browser is the web page browsed?
- What is the screen resolution of these devices?
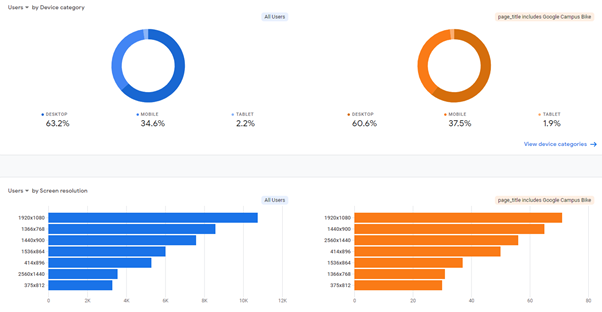
Events
09Conversions
Displays conversion statistics. In GA4, conversions can be set up directly in Google Analytics.

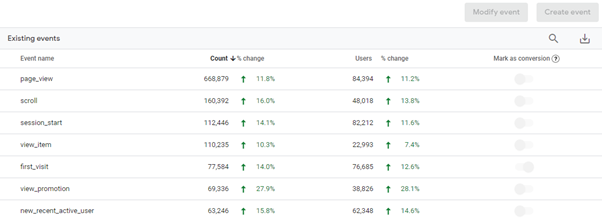
10Events
Events provide an overview of the various activities that visitors to your website have performed. Events can be configured in the same way in GA4.
Explore
11Analysis Hub
The Analysis Hub helps you visually display statistics.
The Analysis Hub offers a variety of pre-configured solutions for free use that allow you to quickly and conveniently create appropriate reports.
Based on these reports, you will get a better overview of customer behaviour on the website.
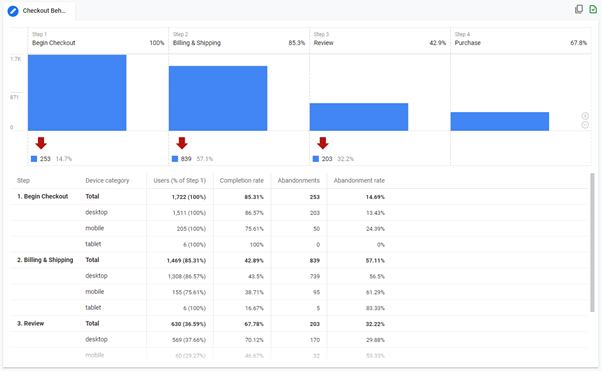
The example below illustrates the behaviour of a shopping cart.
To analyze this report, we have asked 2 questions:
- How many visitors to your cart actually make a purchase?
- At what stage does the website lose the most visitors to the shopping cart?
If a large number of visitors disappear from one stage, it is worth considering whether you can improve this situation.
Such optimizations help increase your website’s conversion rate and marketing budget ROI in the long run.
The example below shows that a large number of people are leaving the shopping cart on the mobile version of the website. This is an indication that this solution should be tested and tried to find out why it is happening.
Configure
12Audience
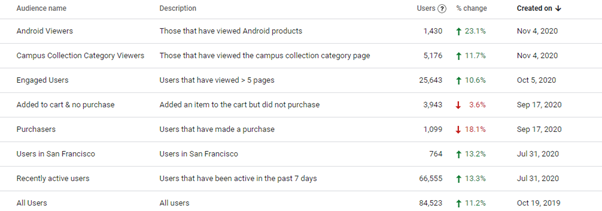
As an innovation, GA4 uses the Audience tool to help you create the audience you want for your website visitors.
For example, if you want to compare one specific target group to another or understand how one target group performs certain activities, you have this option when creating target groups.
Like the GA3 version, you can link your Google Ads account to GA4. This will allow you to share these audiences in the Google Ads environment, allowing you to create remarketing campaigns for the audiences you want.
For example, it allows your website buyers to display a Google Ads ad with a specific message that is important to you.
You can find a detailed overview of how to set up the Audience HERE.
13Custom Definitions
Custom definitions allow you to create metrics and dimensions that suit you. This will allow you to analyze statistics that GA4 itself does not otherwise allow.
This feature is suitable for advanced users.
The peculiarity of GA4 is that analysts have more freedom in analyzing statistics. This is also the reason why many large companies, which collect a lot of information from the website, have decided to take a closer look at the possibilities of GA4.
Read more about Custom Definitions HERE.

14Debug View
Allows you to test configured events and conversions on a website or application and detect anomalies in real-time.
It must be configured before using DebugView. Read more HERE.


