How to use Google Analytics 3?

There are several tools for interpreting website statistics.
One of the – Google Analytics – is the most common among marketers.
If Google Analytics is not set up on your website, how do you know what works and what doesn’t work in your marketing?
Good to know
Google Analytics has had different versions throughout history. At the time of writing (January 7th, 2022), Google Analytics has 2 versions that can be used.
In this example, we’ll take a closer look at the reporting capabilities of Google Analytics Universal Analytics (also known as GA3, which was introduced in 2013).
If you created a Google Analytics account after October 2020, you will be using Google Analytics 4, or GA4.
How to use Google Analytics 3 then?
When using Google Analytics GA3, you’ll immediately see the left-hand menu with a total of 5 reporting tools:
- Realtime – real-time website activity
- Audience – provides an overview of website visitors
- Acquisition – an overview of how visitors found your website
- Behavior – what people do on your website
- Conversions – How and where conversions and sales occur on your website.
In this guide, we’ll take a closer look at how to use these tools and what we can learn from them to improve our marketing activities.
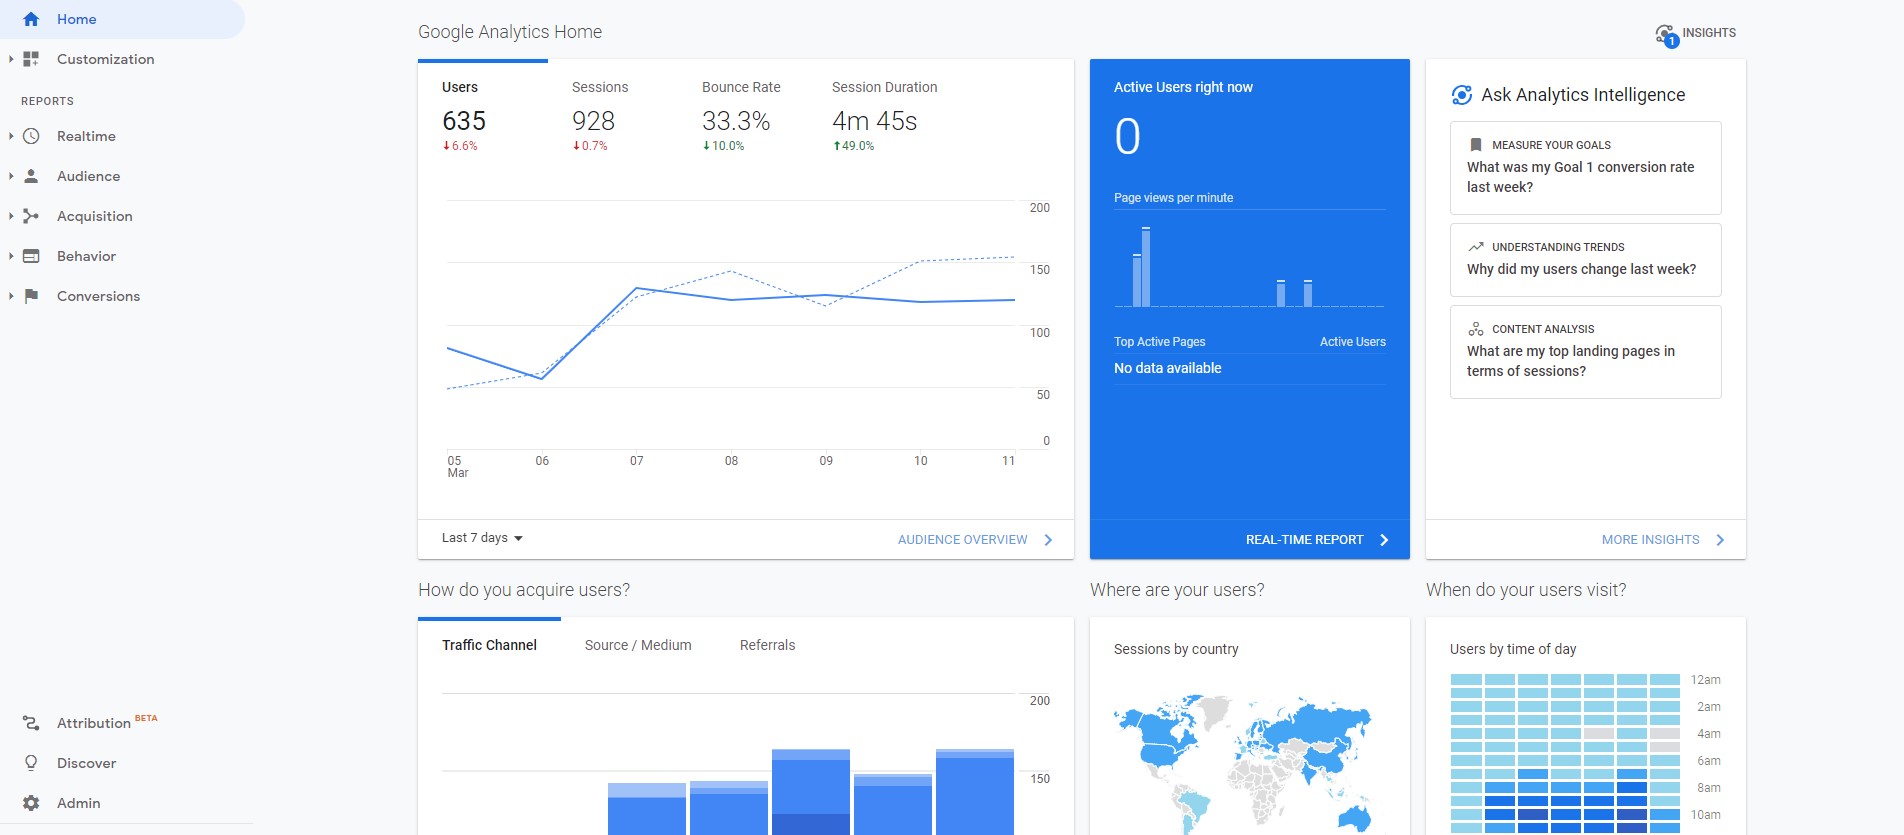
Realtime
01Overview
Overall statistics of:
- How many people visit the site in real-time?
- From what channels have people reached your website?
- What websites get visited in real-time?
- In what geographical areas do people visit the site?
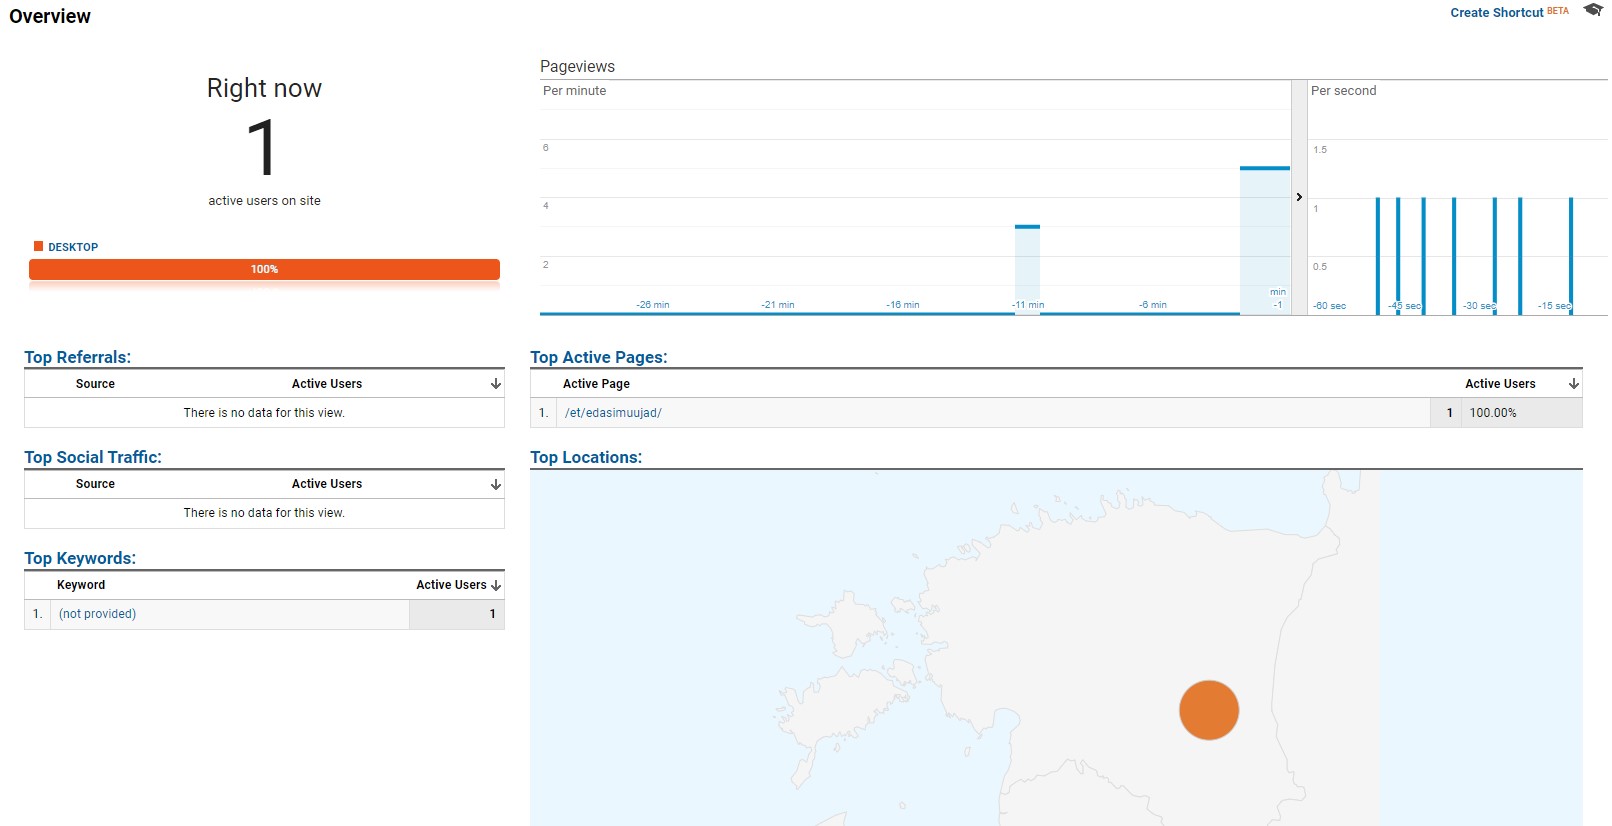
02Locations
For a global website, you want an overview of the regions from which people visit your website. It can be monitored in real-time using an interactive graph.
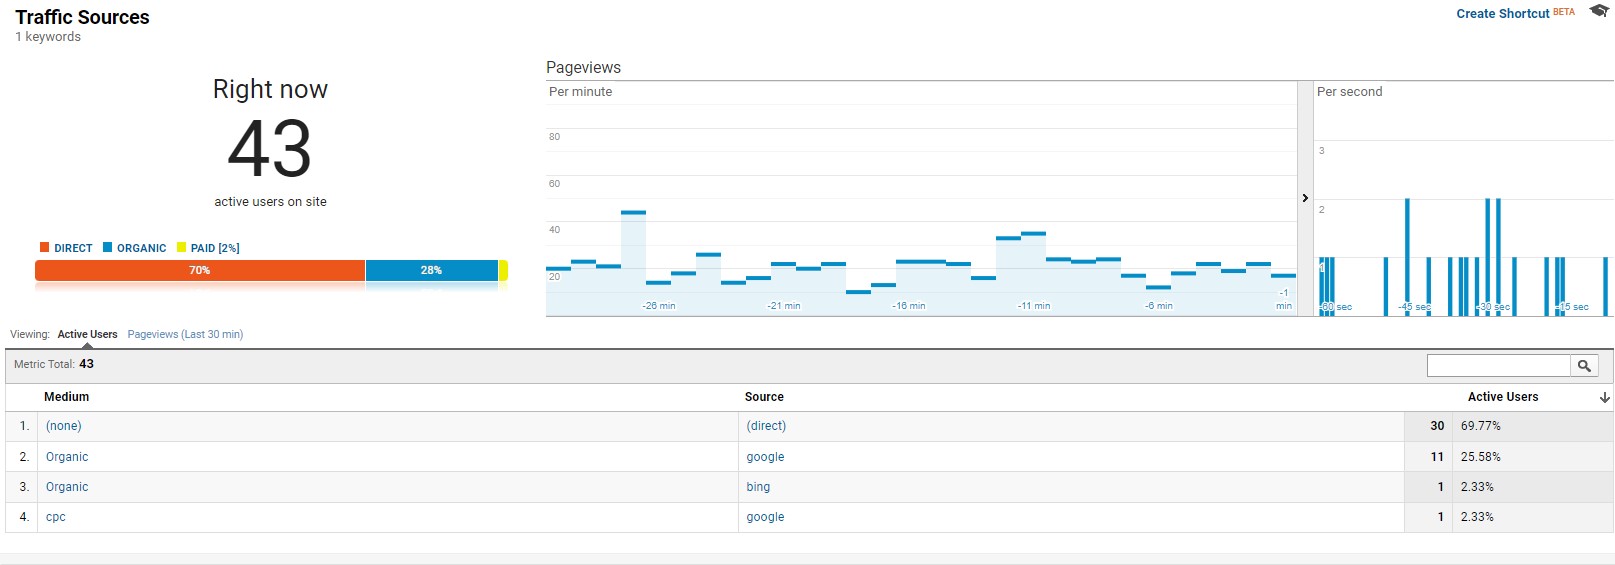
03Traffic Sources
A great tool to use for sudden campaigns, where time is an important factor in campaign success.
We’ve used it for organic campaigns where we share content on Facebook groups or collaborate with influencers.
As with any link-sharing or redirection to a website, the use of UTM plays a huge role in analyzing website traffic in real-time or at a later stage, allowing you to understand which channel and what content a visitor has clicked on.
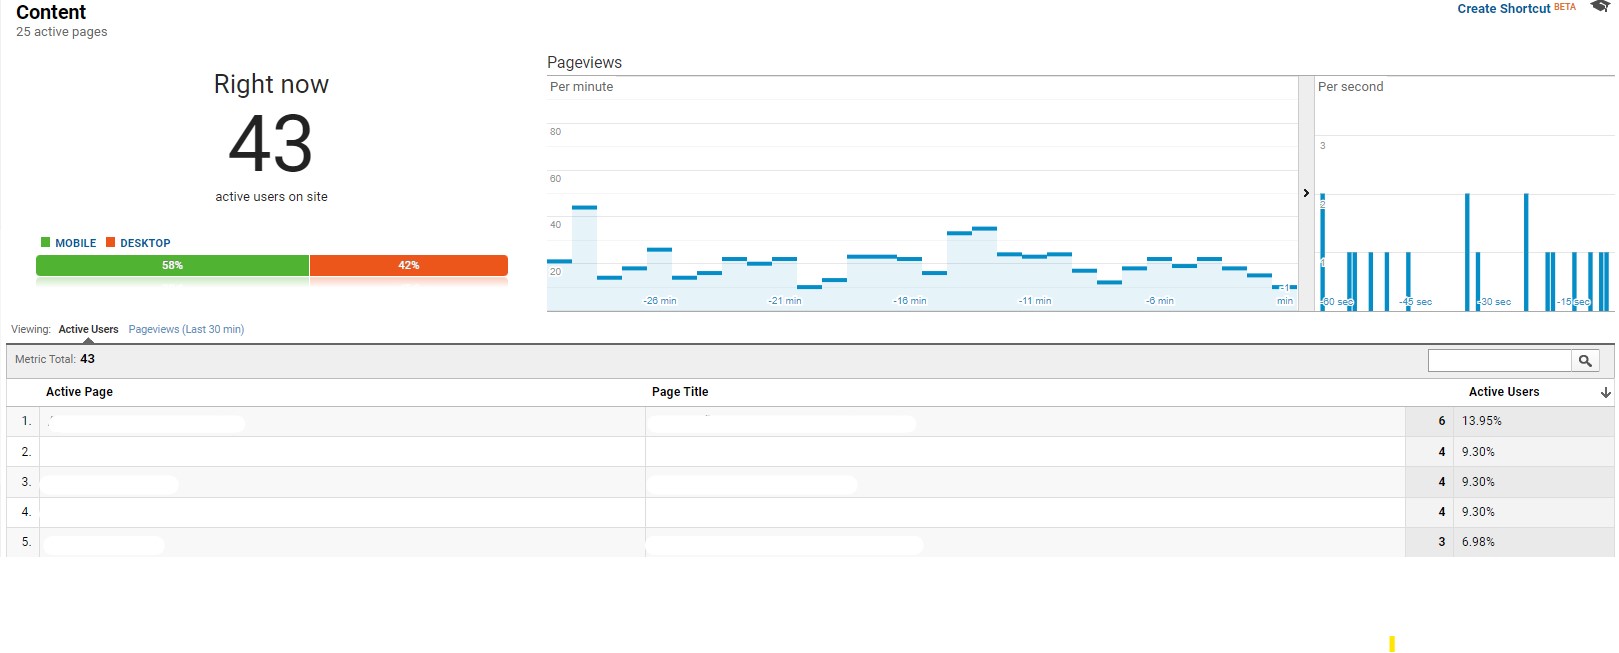
04Content
If you want to see what websites people are visiting in real-time, this tool is indispensable. If your website has different offers for which you are campaigning, then you can see in real-time which products are the most visited and which are not.
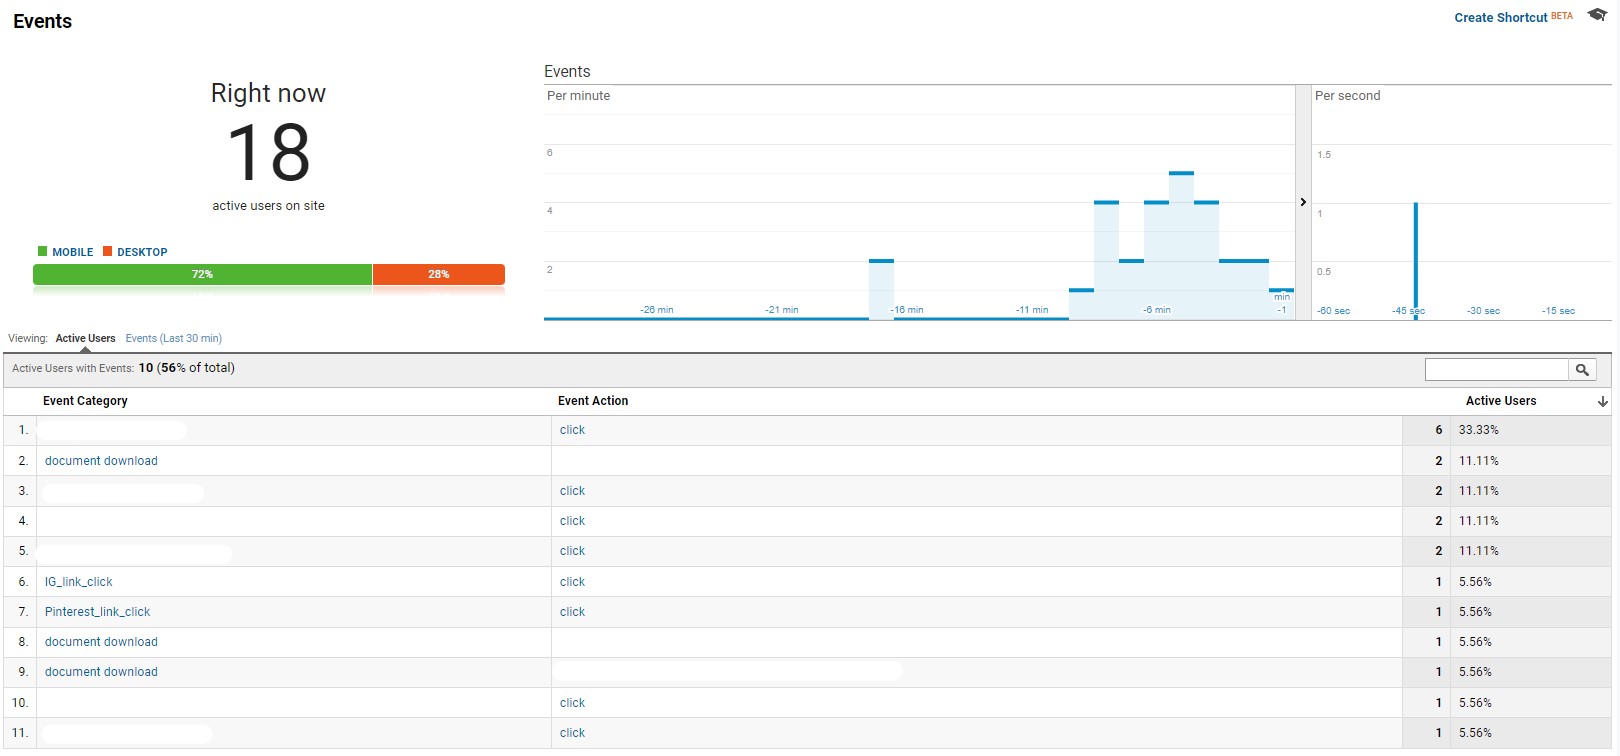
05Events
Allows you to monitor in real-time what people are doing on the website. For “Events”, you need to set up in advance the activities you want to monitor.
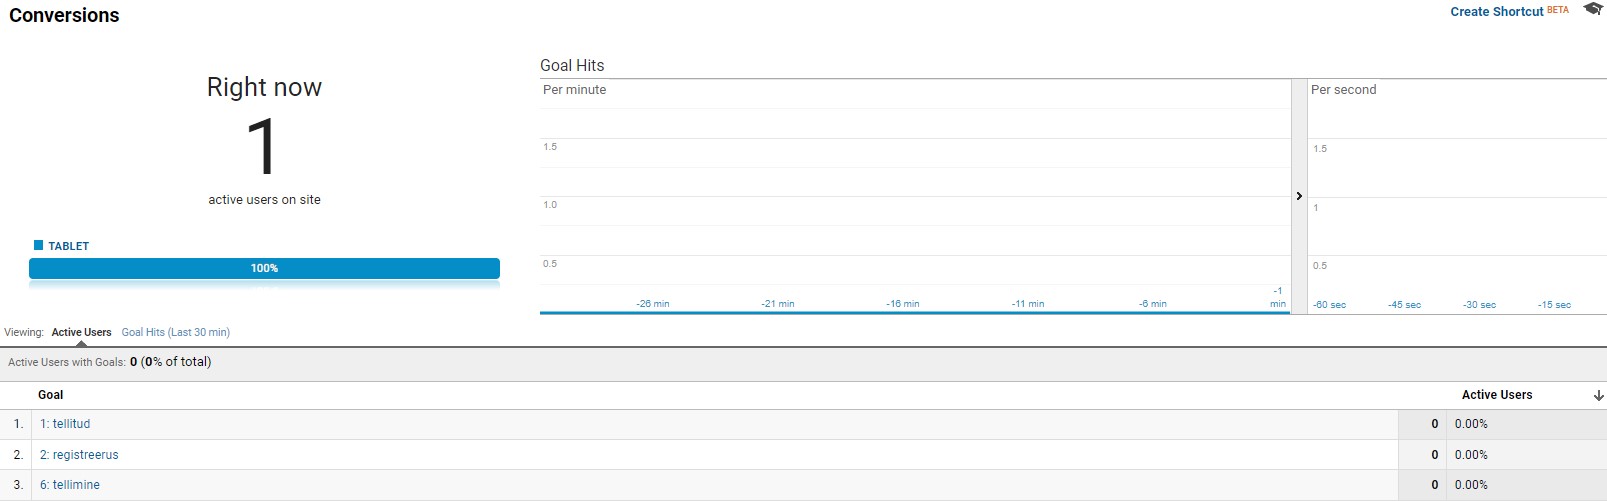
06Conversions
Provides the ability to monitor in real-time what KPIs, or key performance indicators, are being met by people on the website. KPIs need to be set up in advance (we recommend using Google Tag Manager).
Among the various key indicators, it is possible to monitor document downloads, contact requests, successful purchases, filling in questionnaires, etc.
Audience
The Google Analytics GA3 Audience report gives you a better idea of the users of your website. You can understand how long they spend on the website, what their journey is on the website, what devices they use to visit the website, what language they speak, and more.
Let’s take a look at the most used tools in the Audience section.
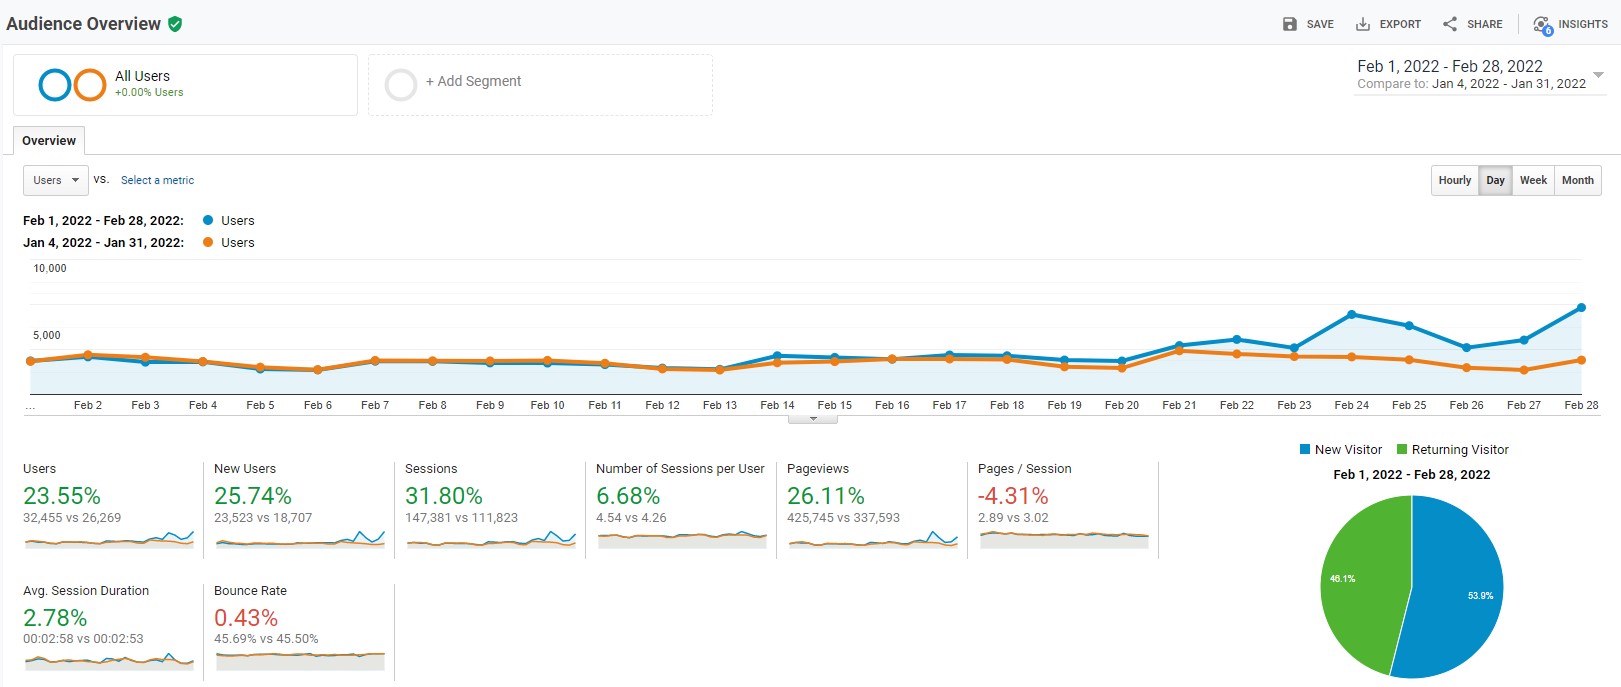
07Overview
An overview of website visitors.
- How many visits have there been in the selected time period?
- How many new website visitors are new unique visitors?
- How many times has the website been visited?
- How many sessions do visitors have on average?
- How many subpages are visited in one session?
- How long time does a person spend on a website on average?
- How many people leave the website without any clicks/actions?
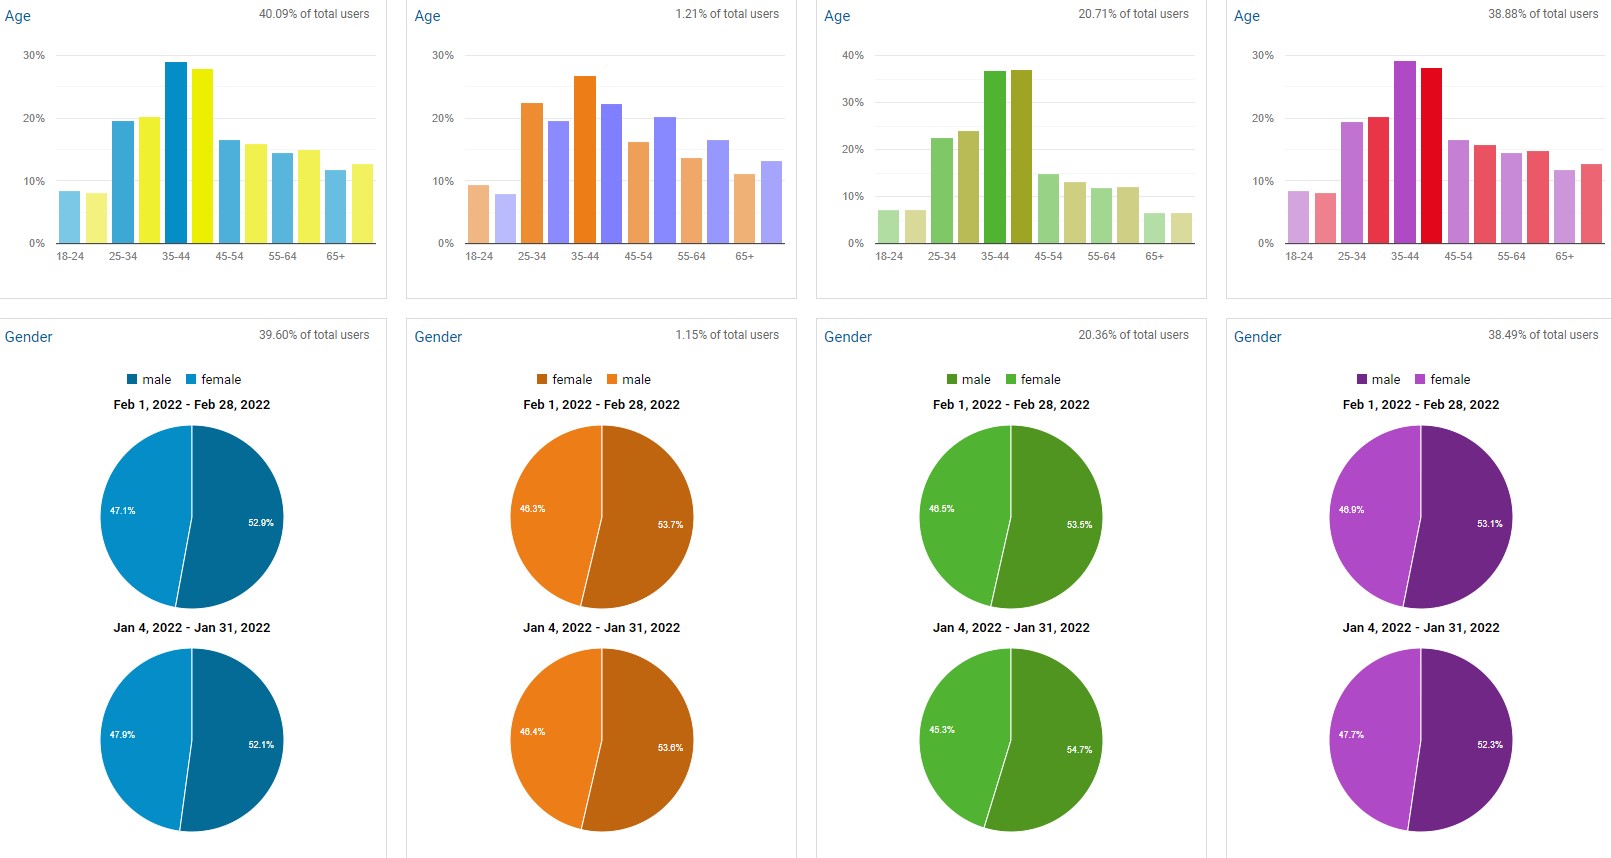
08Demographics
Demographic overview of website visitors. Allows you to analyze how old your visitors are and whether they are women or men.
Google Analytics allows you to analyze statistics using different segments.
In this example, we analyzed:
- Blue – Demographics of all website visitors
- Orange – Converted visitors demographics (visitors who made a purchase)
- Green – mobile user demographics
- Purple – The demographics of non-converted visitors (visitors who didn’t make a purchase).
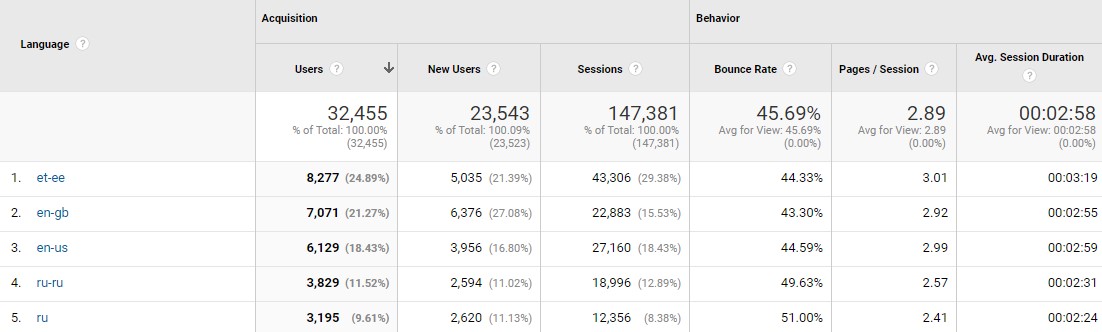
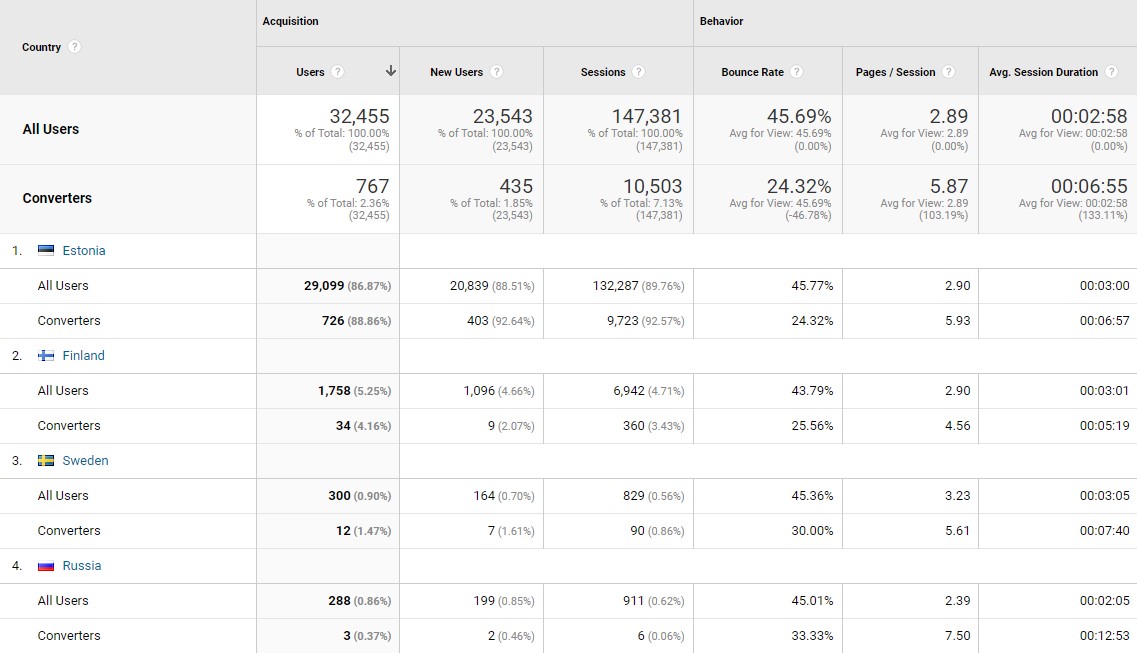
09Geo
Does the question often arise in which languages to translate your website? Google Analytics answers this question.
Of course, you have to understand that Google collects this data from visitors browser settings. Using the “Secondary Dimensions” functionality, you can see exactly which countries people have visited the site in.
The example shows that a large part of the visitors to the website came from Estonia.
However, different languages are used in the browser settings:
- Estonian
- English (USA)
- Russian
- English (UK)
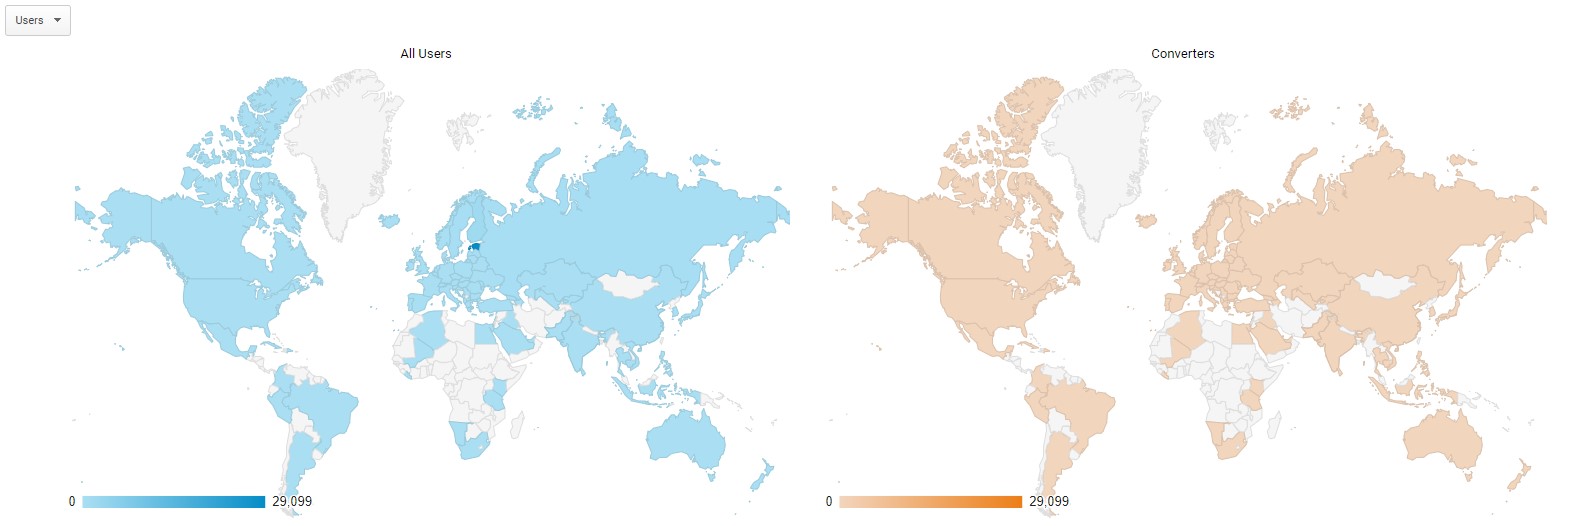
The Geo report also provides an overview of the locations where your website is most frequently visited globally.
In this example, it is clear that although the website has been visited from all over the world, a large part of the visits has come from Estonia.
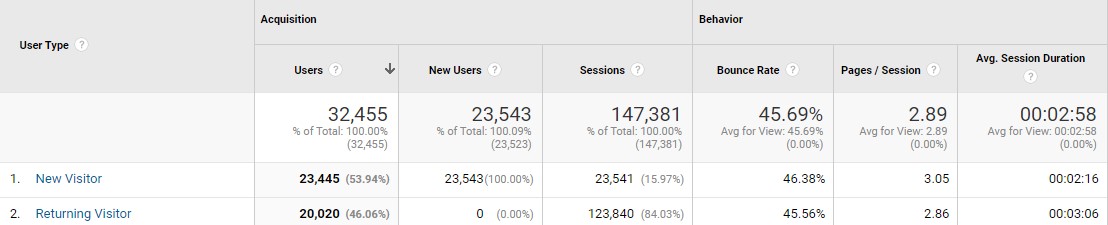
10Behavior
Knowing if your website is being visited more than once will give you a better idea of how to design your website in the future.
If the number of repeat visitors to your website is low, this is an indication that your website is not worth a second visit. You may reconsider adding more content to it to make your site more “sticky”.
There may be several reasons for this:
- The website does not speak to people (test different messages);
- Incorrect targeting of ad campaigns – a person is allowed to advertise one thing but something else is displayed on the website;
- The website is slow and does not open;
- The website has no content to bring people back;
- Your brand awareness is not yet high enough in this sector.
It’s worth remembering that every page doesn’t need repeat visitors. For example, landing pages are not intended to attract people back multiple times.
The Behavior report also provides an overview of:
How many users have returned to the website?
How many times do they come back?
How much website content do they consume?
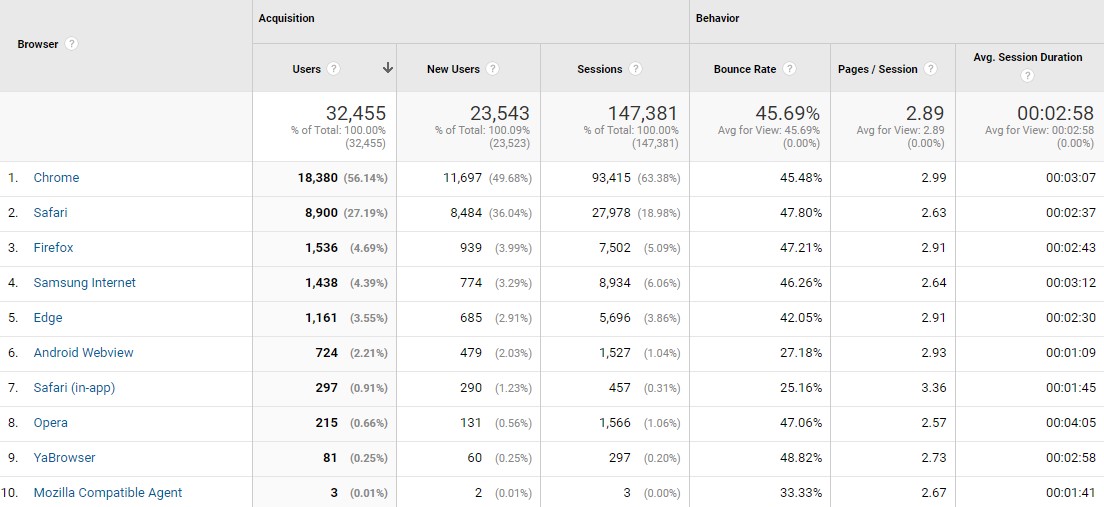
11Technology
If you don’t know which browsers people use to visit your website, you can get an overview with Google Analytics.
This is an especially good report to keep your eye on if you are constantly developing your website. Some browsers may experience some anomalies when using the website.
These anomalies can be observed in this report.
It also helps to better understand the visitor to your website in the content creation process.
In this example, if nearly 60% of visitors use the Chrome browser, it’s an indication to us that we can blog about Google Chrome plug-ins that help make digital marketing more effective.
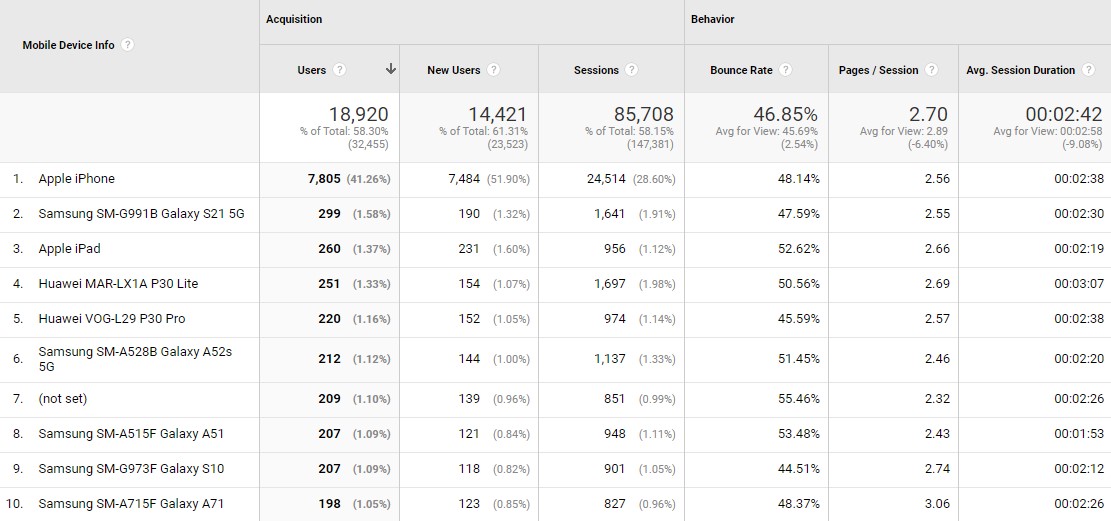
12Mobile
We probably don’t need to single out the mobile-friendliness of the website. It has become the standard in web development today.
Every website could be mobile-friendly. When we think about how we visit websites ourselves, we mostly use a mobile phone for this purpose.
However, there are companies and sectors where this is not the case.
This report will help you better understand how you can create content for your website, how to change the design of your website, and how to make the overall user experience more convenient for people who use mobile devices.
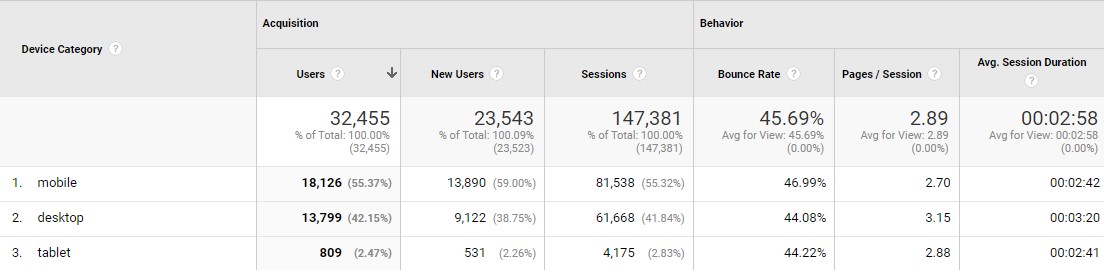
This report will also give you a better idea of the exact mobile phones people use to visit your site.
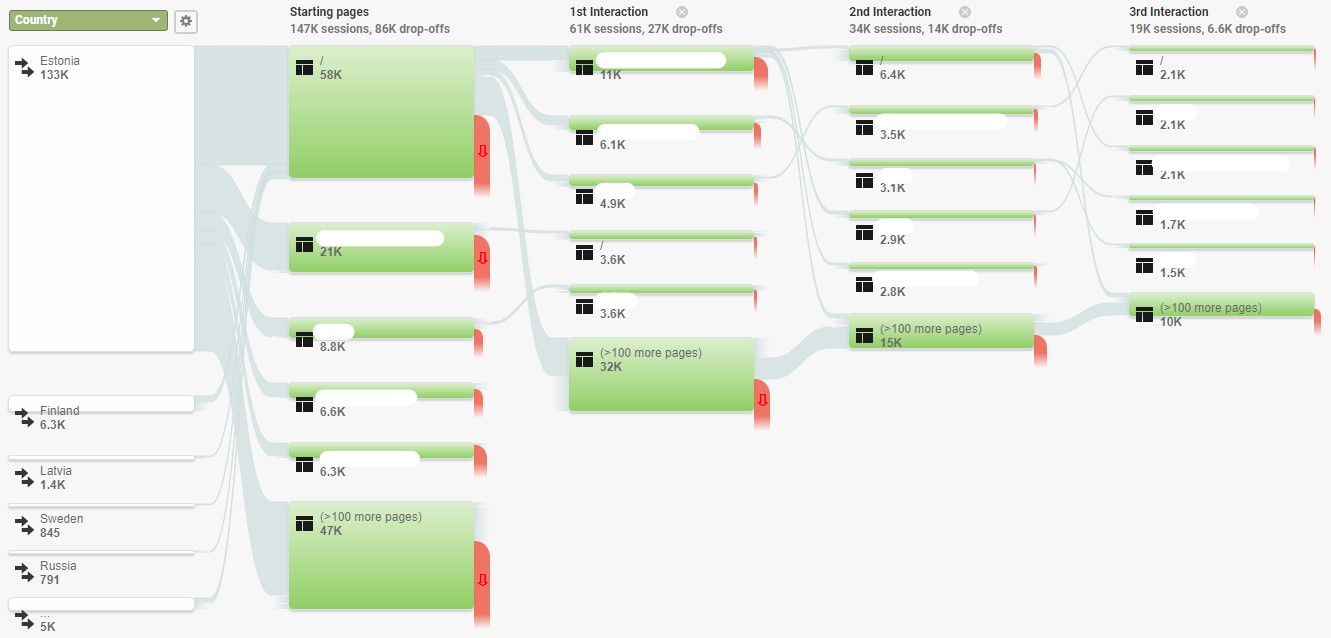
13Users Flow
We recommend using it to map the customer route. A great tool for analyzing what the journey of different regions, age groups, or web browser users looks like on a website.
Often, various errors appear on the website that hinder the fulfilment of the desired goals (purchases, forwarding of contact requests, etc.).
Acquisition
14Overview
The Acquisition tool helps you understand the channels through which people reach your website and which campaigns bring the highest quality traffic to it.
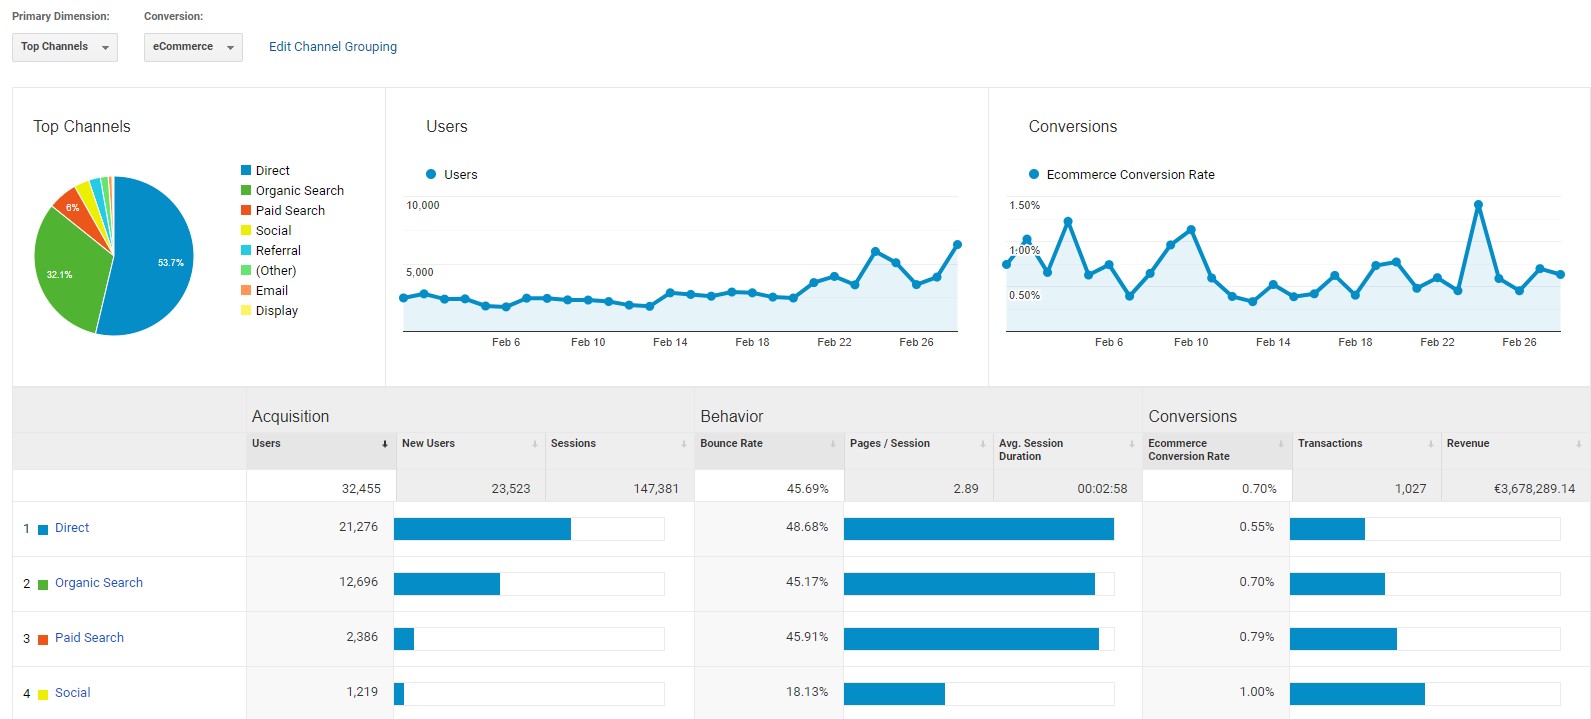
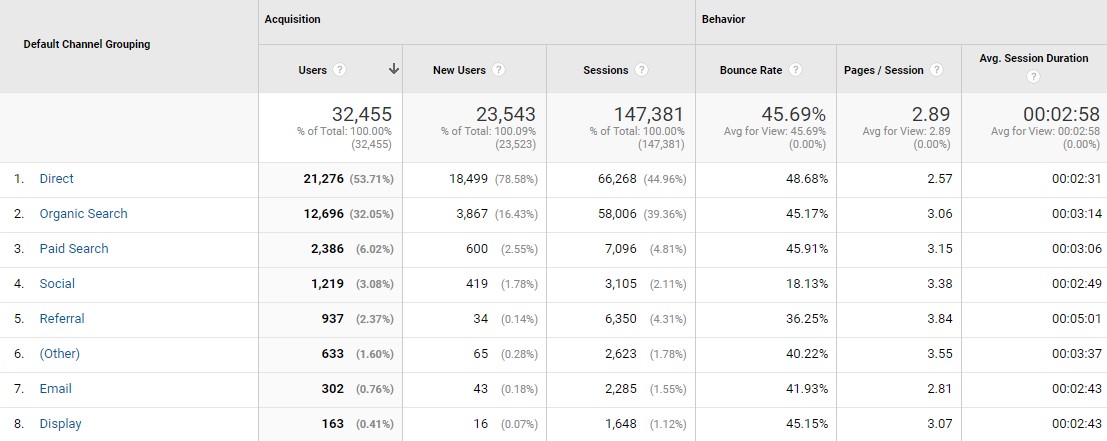
15All Traffic
Channels
An overview of the generated web traffic by channels.
Allows you to analyze through which channels the majority of online sales were generated, through which channels the most contact inquiries were transmitted, etc.
It also makes it possible to analyze which channels you should invest more in the future.
This example shows that paid advertising on Google channels works very well. A large number of people reach the website through this channel and 31% of them are completely new visitors. The bounce rate is rather low – 24.85% have left without any action. At the same time, an average of 5.73 pages were visited during one session. The average length of one session is 3 minutes and 18 seconds.
If you look at organic traffic to your website, it will have a higher bounce rate and fewer web pages per session, which is an indication that you should reconsider your SEO strategy – make it more valuable to the visitors.
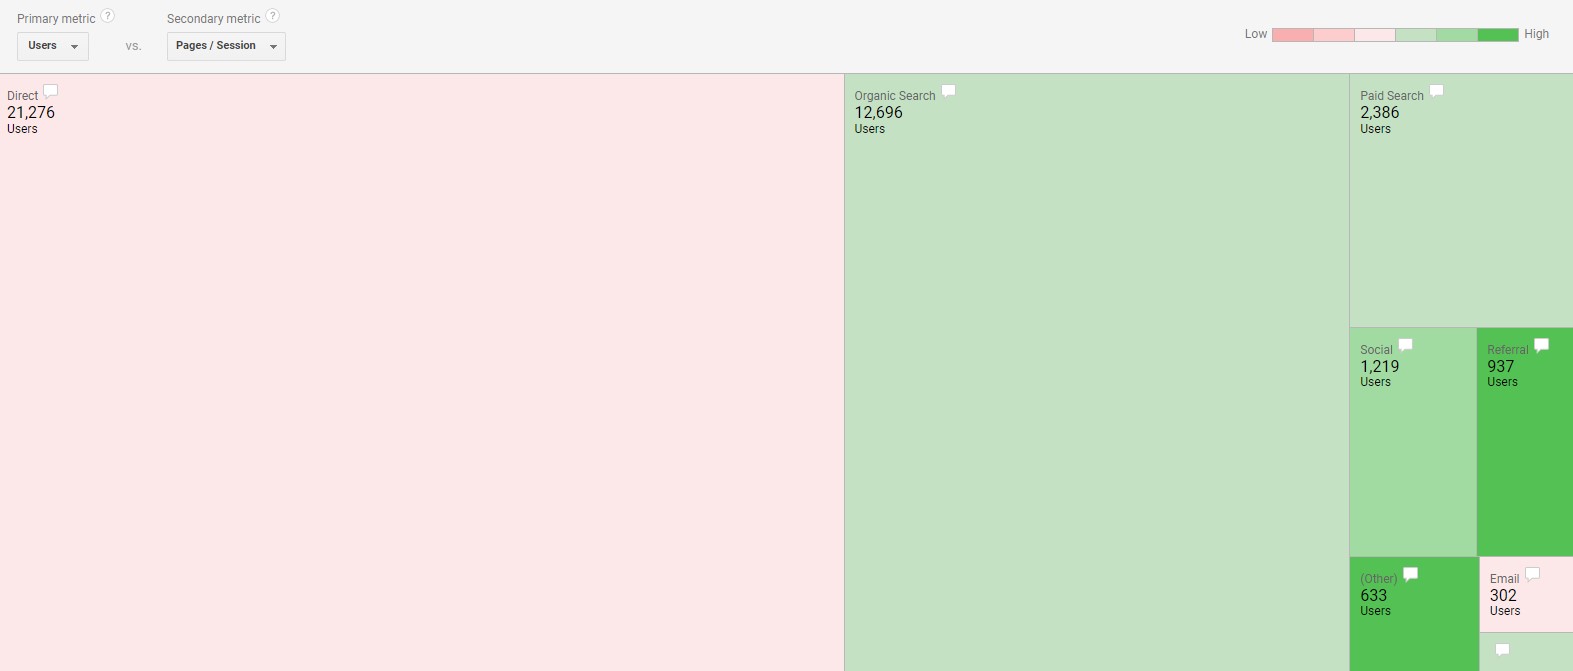
Treemaps
Allows you to analyze, for example, the % of new sessions for new users across channels. We can read from the graph that the % of new sessions on this website is higher due to the web traffic generated via social media.
We can conclude from this that if the goal is to make the website known among unique people, then it would be worthwhile to run a paid campaign on social media.
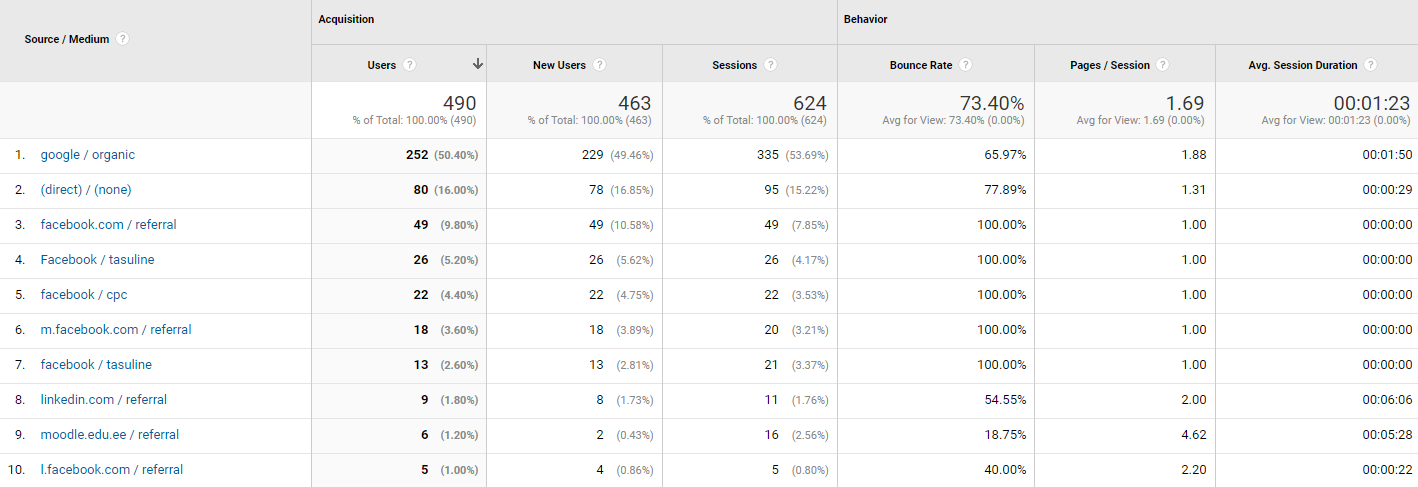
Source/Medium
It gives you an opportunity to analyze the sources and mediums that generate website traffic from different channels.
The example shows that most of the traffic has been generated from:
- Linkedin advertisements
- LinkedIn groups
- LinkedIn personal profile
- LinkedIn page
Grouping different sources and mediums give us a better idea of where your visitors found the link to your webpage. If we only knew that the visitor came from the LinkedIn channel, we wouldn’t understand whether we need to optimize paid ads for future activities or share the link to our LinkedIn posts more often.
Google Ads
By linking your Google Ads account to your Google Analytics GA3 account, you can keep an eye on your Google Ads.
The integration allows you to analyze traffic to your website through Google Ads – which campaigns work, what keywords people use to find you on the web, and more.
In addition, you’ll see the statistics about which keywords triggered your ad.
Search Console
Google Analytics allows you to set up a Google Search Console for your website, which is free for everyone.
This allows you to:
- See the webpage the way Google sees it, so you can check if Google’s robots interpret your webpage the way you want them to
- Provides an overview of the technical condition of the website
- Helps you find out why your website isn’t appearing in Google’s search results;
- Gives you valuable data about keyword-based statistics.
Social
Clear overview of the social channels that help you generate more traffic and sales on your website.
Campaigns
A complete overview of your social media campaigns, previously created, and how those campaigns have generated new sales or contact inquiries.
You must use UTM for links to get campaign information.
You’ll also get a better understanding of paid keyword advertising campaigns and the organic keywords that people use to find your website’s search engine.
Behavior
16Overview
Behavior report helps to better understand visitor activities on the website.
- What pages do people visit on your site?
- How many different pages do they visit?
- Which pages get the most/least attention?
17Behavior Flow
Gives an overview of which pages people land on their first visit to, and what their journey looks like on your website.
Shows which websites have the biggest drop-offs, ie which pages visitors leave the website from.
18Site Content
It allows you to:
- Analyze whether landing pages are understandable to the visitors
- Track which page people visited before they left the site.
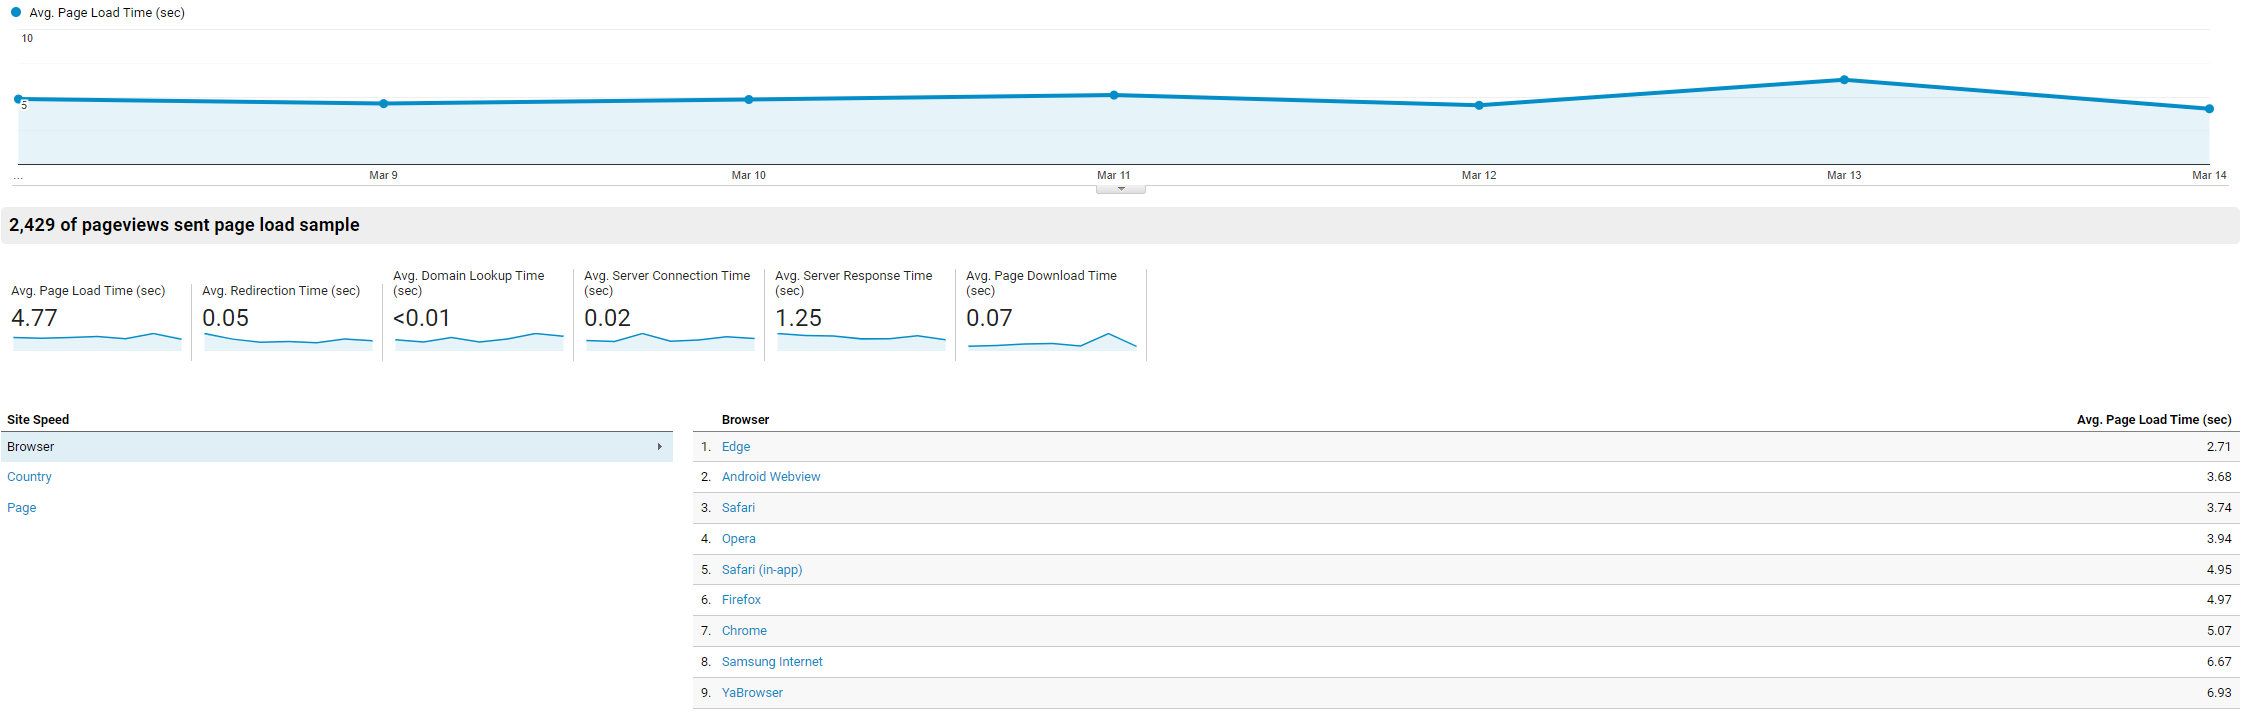
19Site Speed
The report shows the loading speed of the website and allows you to map how to improve its speed.
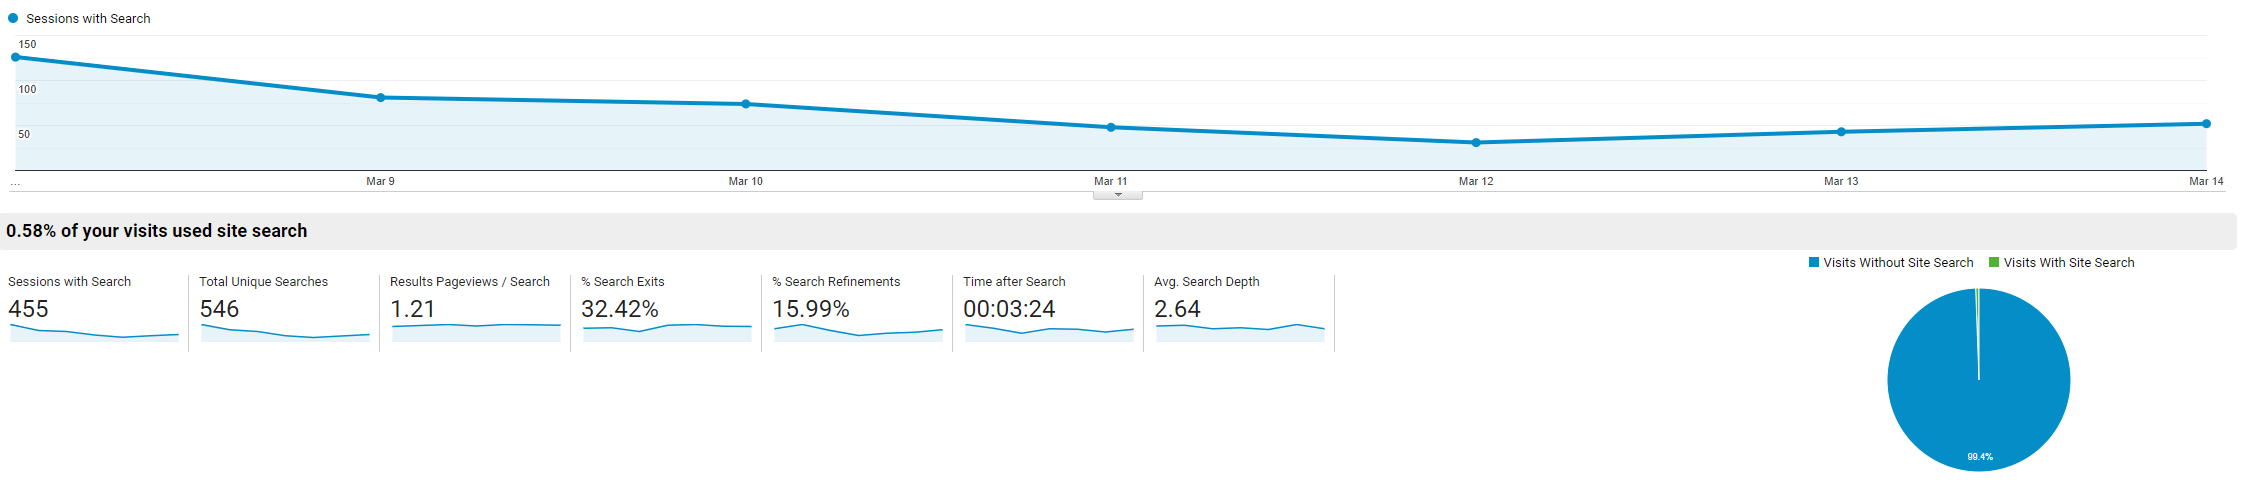
20Site Search
A detailed overview of using website search.
- How many visitors of your websites visitors use website search at all?
- What exactly are they looking for?
- On which pages do they use the search feature?
- How many people leave your website after searching (a high bounce rate is an indication that the person did not find the website they were looking for)?
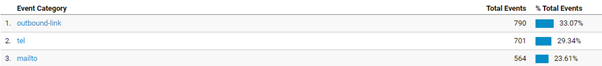
21Events
Allows you to monitor what activities are happening on your website.
Helps to measure:
- Clicks on external links
- Forwarded contact requests
- Clicks on a phone number
- Clicks on employee email addresses
- Pressing the “Play” button for videos, etc.
You can find more information about setting up Events HERE.
Conversions
The Google Analytics GA3 Conversions report is a great tool for understanding the KPIs your website meets.
The report allows you to see how many KPIs have occurred in the desired time period, which websites generated the most conversions, and what the customer’s path to conversion was.
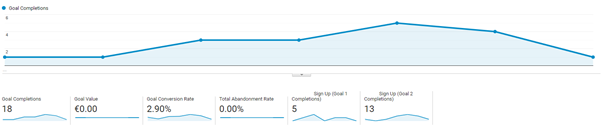
22Goals
The Goals report helps you keep track of the activities you’ve identified as key indicators. For example, forwarding different contact requests or registering as a user in this example.
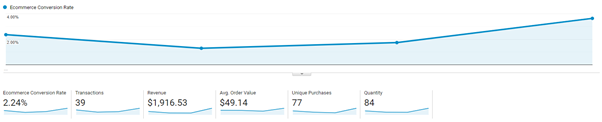
23Ecommerce
The Ecommerce report helps you keep track of online sales – how many orders were placed, which is the average order amount, how many unique purchases have been made, how much turnover has been generated through the online store, and so on.
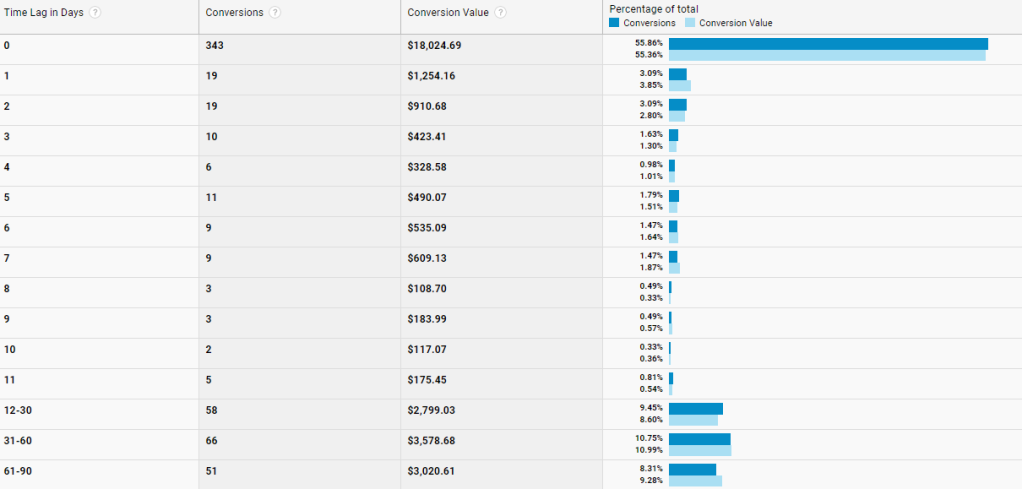
24Multi-Channel Funnels
Multi-Channel Funnels is a powerful tool for understanding which channels are helping to engage people in the sales cycle and which are helping them complete sales.
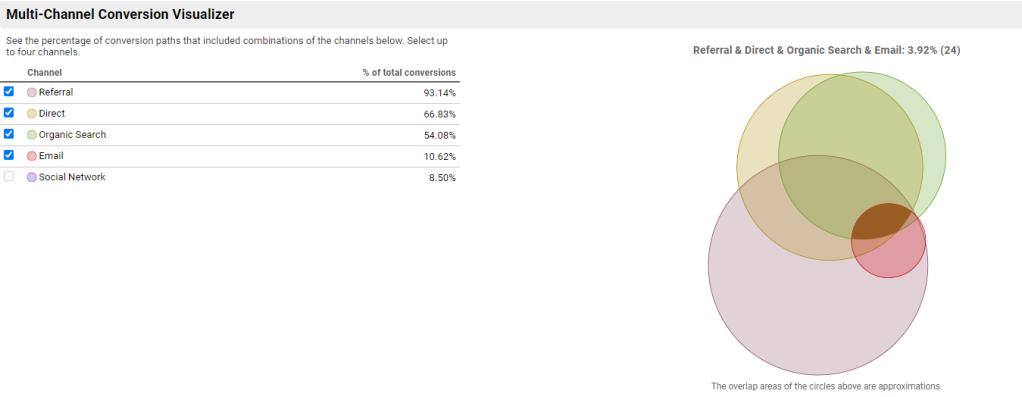
Provides an overview of the channels through which people have been associated with your brand over time before it converts.
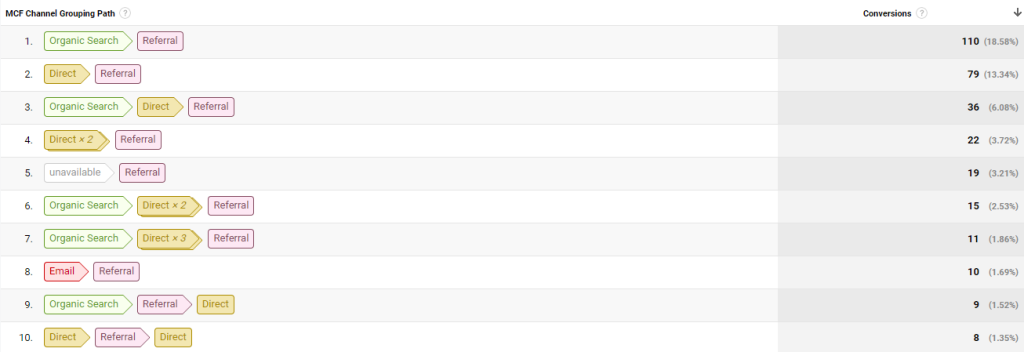
It also helps you track how long does it take from a web visit to a purchase.
Conclusion
Universal Analytics (GA3 )offers a variety of ways to better understand your visitors.
Understanding your visitors will help you optimize your website – all in order to increase the online purchases through your website or meet other key metrics that are important to your business.